

Where Nepal's District Data Comes From, and Why the Numbers Disagree
A reader's guide to how district-level data in Nepal is produced, which office to trust for what, and how to spot a figure that is out of date or answering a different question than the one you asked.

Anyone who has tried to pin down a single number for a Nepali district knows the feeling. One office gives you a population figure. A local profile gives you something slightly different. A news report from a few years back gives you a third. None of them is necessarily wrong. They are usually answering slightly different questions, on slightly different dates, using slightly different boundaries.
So instead of handing you a district profile built on numbers I cannot stand behind, here is the more useful thing: how district-level data in Nepal is actually produced, where each piece comes from, and how to tell whether a figure you found is worth repeating.
Start with the census, then check the date attached to it
The national census is the backbone of nearly every district figure you will encounter, from population and households to literacy and mother tongue. In Nepal it is run by the National Statistics Office, the body formerly known as the Central Bureau of Statistics. The most recent census was carried out in 2021, and its district and local-level tables are the ones most reports are still drawing on.
The catch is that census data describes a moment. A district's population figure from 2021 is a 2021 figure, full stop. Migration, municipal expansion and the movement of people out of hill districts and into the Tarai and Kathmandu Valley have all kept moving since the counting finished. When a website shows you a district population without a year next to it, treat that number as a question rather than an answer.
Also read the table headings properly. "Household" and "family" are not the same thing in practice, and neither is "population" the same as "registered voters." A lot of the confusion people blame on bad data is really a mismatch between definitions.
Maps and boundaries are a separate question entirely
Population comes from the statistics office. Area, district boundaries and the rivers and ridges that mark them come from the Survey Department. These two sets of information are produced for different purposes and do not always update in step, which is why you sometimes see an area figure that looks like it belongs to an older map.
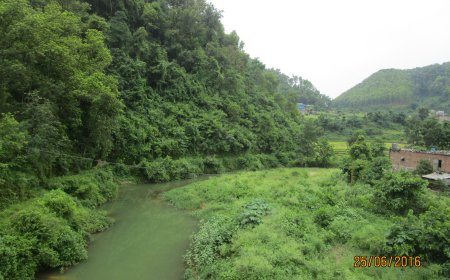
If you need to describe where a district ends, go to the Survey Department's published maps rather than to a travel blog's rough description. Geography is one area where a picture genuinely beats a paragraph.
Ward numbers are where things get messy
Since the 2017 restructuring, districts have been divided into rural municipalities and municipalities, and those into wards. Several different bodies touch these numbers: the Ministry of Federal Affairs and General Administration, each District Coordination Committee, and the Election Commission. Each maintains its own list for its own purposes.
They drift apart. A ward gets split, a municipality annexes a neighbouring area, a name gets spelled three ways across three spreadsheets. If you are citing a ward count, cite the body you got it from and the date you checked, and if two sources disagree, say so rather than quietly picking the one that suits your sentence.
Postal codes, trade figures and the awkward edges
Postal codes for Nepal are issued by Nepal Post, and the only list worth trusting is the one published by Nepal Post itself. Third-party directories copy each other, mistakes and all. Check the issuing source and note when you looked, because codes do get revised.
Border trade is another trap. Customs and industrial figures come from the Department of Customs and the Department of Industry, and they are reported on their own schedules, in their own formats, sometimes covering fiscal years rather than calendar years. A trade number without the fiscal year attached is close to meaningless, and a trade number quoted from a secondary source is worth checking against the original release before you build an argument on it.
The Election Commission publishes what the others don't
Constituency boundaries, seat allocations and voter rolls sit with the Election Commission, and they are the authority for anything electoral. These change after delimitation and after elections, so a figure that was accurate a few years ago may simply be obsolete now. Go to the Commission's current notices rather than to an older summary.
A short checklist before you repeat a number
- Who produced this figure, and can I name them?
- What year does it describe, not just what year it was published?
- What exactly is being counted, and does that match what I want to say?
- Do two independent primary sources agree? If not, have I said so?
- Is this still current, or has a boundary, ward or constituency changed since?
None of this is glamorous work. It is, however, the difference between a district profile a reader can rely on and one that quietly falls apart the moment somebody checks. When the verified tables and citations are in hand, a full district profile becomes worth writing. Until then, pointing readers to the right offices is the honest version of the job.
What's Your Reaction?